The 2015 Waste Characterization Study
A comprehensive Integrated Solid Waste Management Programme (ISWMP) funded by the Government of Barbados (GoB) continues to be implemented for the country. The ISWMP has synergistic physical and non-physical components and is being executed through the Ministry of Environment and Drainage (MED) by the Project Management Coordination Unit (PMCU).
The policy development (non-physical) component of the ISWMP requires that a comprehensive Waste Characterization Study (WCS) is conducted every ten (10) years. This WCS is necessary to provide relevant, reliable, impartial and valuable data along with its analyses on the composition and quantity of solid waste being generated.
Subsequent to a request for proposals (RFP) to conduct the WCS 2015 for Barbados, four (4) distinguished firms submitted proposals. After a Technical and Financial Evaluation Process by the Steering Committee, the firm Simmons & Associates was awarded the contract on February 27, 2015 with contact price of US$76,665.50.
How Did They Do it?
The WCS 2015 sampling rounds were undertaken over three (3) distinct periods to obtain accurate waste distribution data as follows:
- Period 1 – April (Dry season)
- Period 2 – July/August (Crop Over season)
- Period 3 – February 2016 (Tourist season)
Quantity of Solid Waste Generated in Barbados 2015
Pie Chart 1 below shows the average of all three (3) rounds of WCS 2015
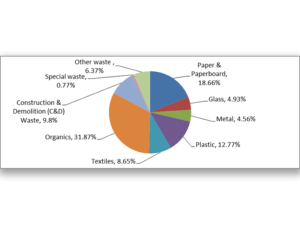
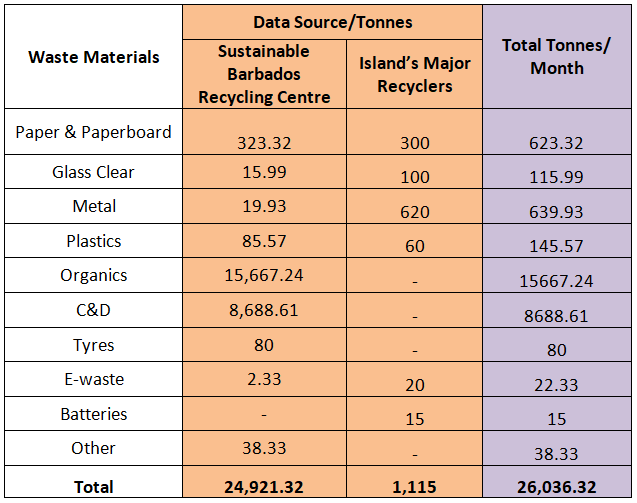
Table 1 below shows the quantity of solid waste generated in Barbados in 2015
Analysis of the Results of WCS 2015
To perform a relevant analysis of the WCS 2015, it was necessary to provide a credible reference set of data points to create the platform for a comparative analysis. To this end it was decided to use the official results of the previous waste characterisation study conducted in 2005.
Summary of Analysis of the Quality of Solid Waste Generated in Barbados in 2015
Table 2 below shows the variability and distribution of the solid waste generated in 2005 and 2015.
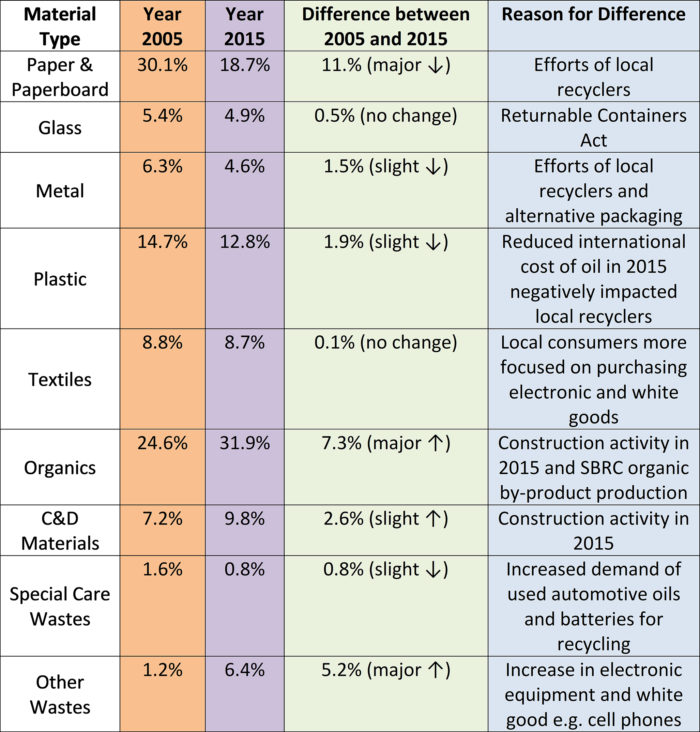
Table 3 below shows the overall volume or quantity of the solid waste generated in 2005 and 2015.
Table 3
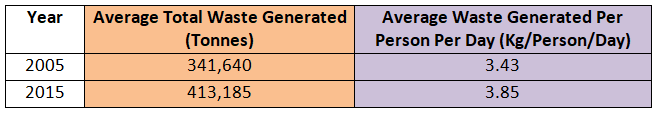
Between 2005 and 2015, the average quantity of solid waste has increased by 20.9%. This can be further extrapolated to represent a “very conservative and acceptable” yearly increase of 2.1% per year since the 2005 baseline. This is in part due to:
- Following the fundamentals of ISWMP
- Functions of SBRC
- State facilitated private recycling activities resulting in major exports of recyclables (16,380 tonnes exported annually)
Conclusions
- Between efforts of SBRC and local recyclers, waste generations rates have been maintained at stable and acceptable levels
- Local recycling activities continue to thrive although international markets for the sale of recyclables were volatile.
- More effort is required by SBRC to utilize the organic fraction of the waste stream.
- Waste diversion programmes can be improved by addressing legislative deficiencies, increased source separation and more public participation in recycling.
Recommendations
- Provision for increased awareness campaigns geared at heightening sensitivity among the entire populace on the importance of waste diversion as well as source separation.
- Improved techniques with respect to information dissemination which seeks to provide critical stakeholders with recommendations on the best practices.
- Introductions of subsidies/tax incentives to support the recycling programmes which focus on the waste streams which have been identified as a priority for diversion.
- Continued efforts should be made to engage communities in a very structured and organised way to participate in waste recycling and diversion programmes.